vMAP Object Inspector in Tax Mapping
Generating revenues from real property tax is a crucial aspect of every city’s operation. Through an organized and reliable record management system, city assessor offices can easily monitor collection performance and payment delinquencies. With GIS in the picture, not only that they can visualize the location of properties, but they can also analyze trends and patterns using the rich number of attributes on the data.
What is Tax Mapping?
Tax mapping refers to the systematic use of GIS or any other mapping technologies in the acquisition, processing, and management of parcel information for valuation, assessment, and revenue forecasting among other things. Nowadays, tax maps are generated using high-precision survey tools stored digitally in a GIS, accessible to the city constituents in a form of web mapping applications. But back in the day, tax maps are usually stored in large-format papers, stowed in steel cabinets at the office's basement. Yes, those hand-drawn maps in a brown tracing paper are very much responsible for the huge amount of revenues coming into the city in the form of real property taxes.
An example of a hand-drawn annotated tax map. (Image Source: https://cdn11.bigcommerce.com/)
vMAP GIS in Modern Tax Mapping
Since the proliferation of modern GIS, one of its main purpose in tax mapping is to visualize the location of real properties. While city administrators are mostly interested in the potential revenues that may be generated with the existing schedule of market values, the city assessor is mostly concerned to have a glance at the portions of the city that has low collection rates or those that have many delinquent properties to increase their revenues. On the other hand, taxpayers are more interested in the market value of their properties. While they may need different information from these tax maps, it is important that this information can be easily and effectively communicated to each stakeholder.
Object Inspector in vMAP provides a means for users to easily view information about the features displayed on the map. Say you are one of the tax mappers who manages the parcel data of your city and the city assessor tasked you to share some basic information on the land parcels data that you managed to other groups such as the appraisal and valuation division in your department. Currently, the parcel data contains a lot of information including sensitive data such as the owner's name, owner's address, which you do not want to be shared outside of your group.
By configuring Object Inspector in vMAP, you can display a filtered set of parcel information from hundreds of attributes so other users can only view the basic information that they need. This may help prevent leakage of sensitive information to unauthorized personnel which may be used against the taxpayers.
As mentioned earlier, some users may need to view a different set of information from the others. This time let's say some brokers requested to view the land and building market values of a certain parcel. And since some buyers may have a bigger budget, they may need to acquire multiple properties depending on their market value.
You can configure vMAP Object Inspector to display aggregated values based on multiple records selected on the map. Say three parcel records are selected on the map, you can set in the Object Inspector to automatically get a summary statistic of the market values such as average land market value and total market value of land and building.
Aside from these samples, you can freely configure vMAP's Object Inspector using HTML in the vMAP Admin Portal page depending on the needs of your organization. The panel can also contain multiple tabs, so you can organize the presentation of data more effectively.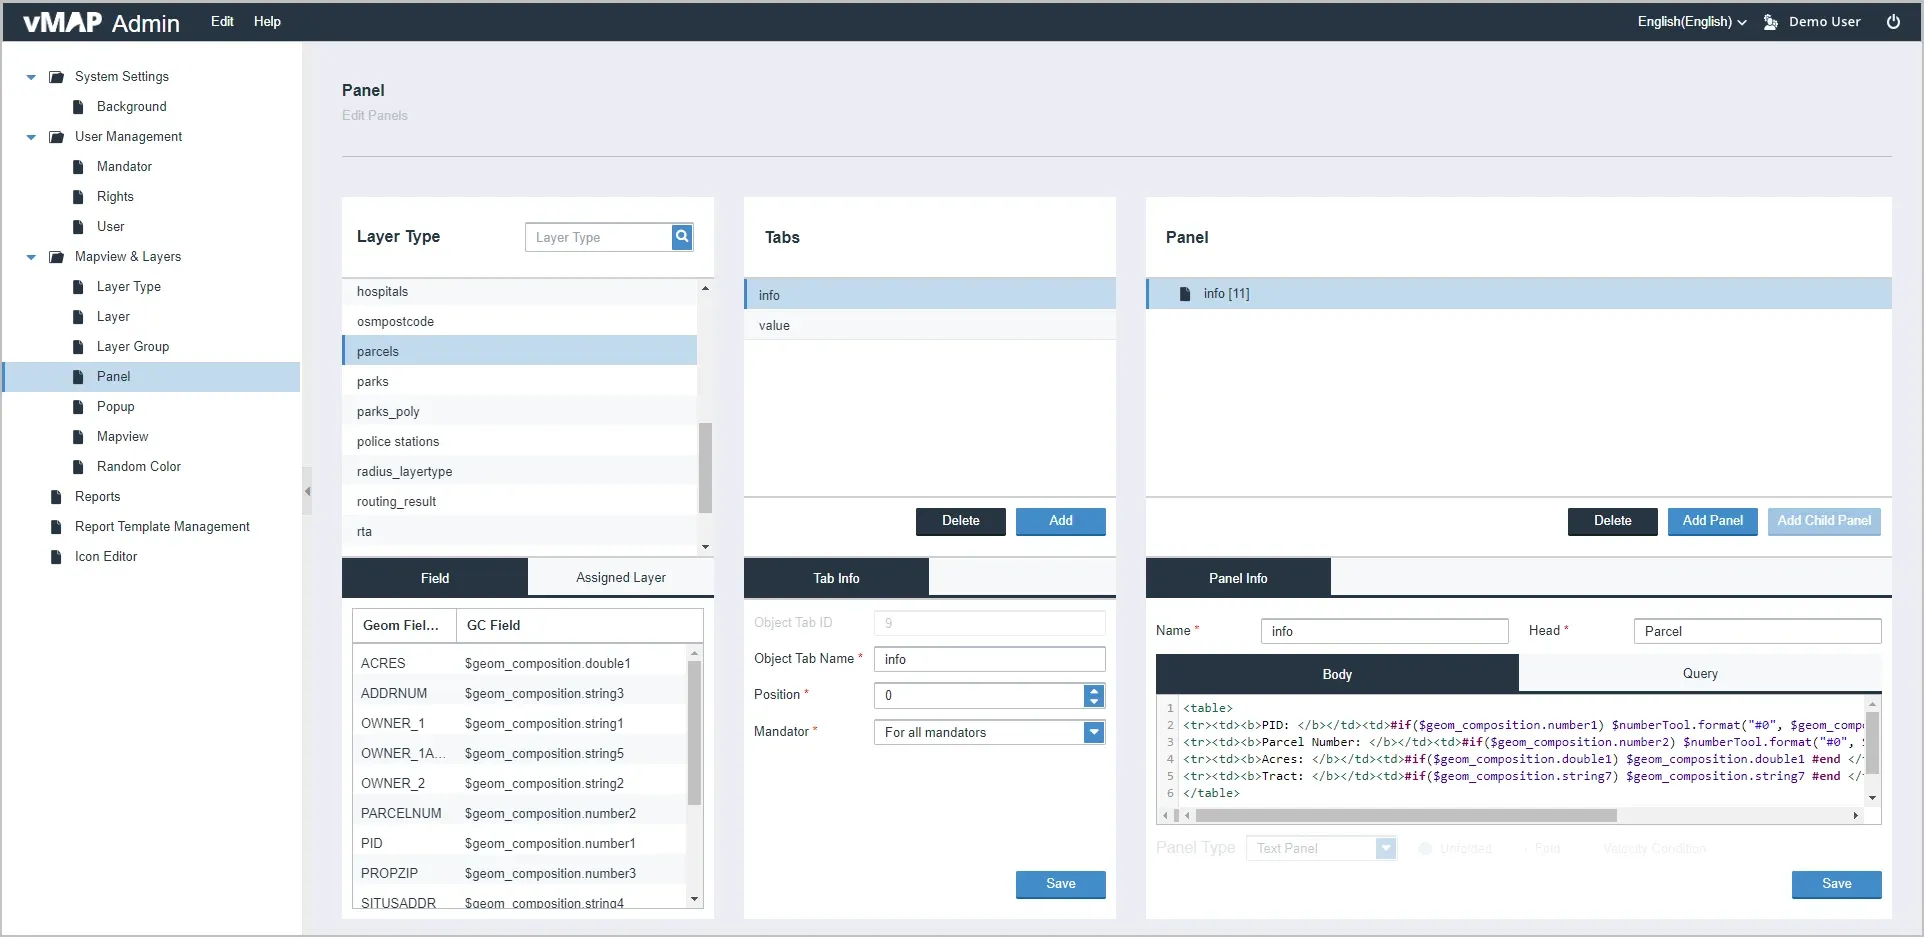
Object Inspector in vMAP gives you the ability to display information on the selected features on the map depending on the restrictions set by your organization. This also provides a means, so viewers can easily see the results of a query, formula, or expression defined by your analysts. Depending on the set of attributes on your data, you can use Object Inspector to effectively display important information about your data.