Dynamic Map Filtering and Site Selection in vMAP
Modern Day Marketing
Whether you are starting your first business venture or expanding an already successful franchise, one of the crucial aspects of business for entrepreneurs is location. Deciding where you will put up your first laundromat or the third branch of your milk tea franchise ultimately determines the success or failure of the business venture. Before, determining this usually takes so much time and resources due to the limited or sometimes lack of essential data (i.e. demographics, physical, and socioeconomic) that will help identify potential candidate sites. But with the continuous influx of digital data today, almost all these are now accessible or can be easily acquired through modern data acquisition techniques.
As competition across various industries increases, targeting the right customers today is not only about where they live anymore. Site selection and market research, with the aid of modern mapping tools can now look at different fabrics of the population, as well as various physical and environmental factors to strategically target customers. With GIS, business owners can now easily determine where to locate a new retail store or logistic warehouse. And aside from audience’s location, several elements such as accessibility, cost, and competitor’s intelligence can now be included in marketing studies.
Site Selection Using GIS
Most of the site selection methods nowadays that utilizes GIS can be done using desktop application programs. In the world of proprietary GIS software, Esri, with its Desktop applications ArcMap and ArcGIS Pro, together with several extensions such as Spatial Analyst and Network Analyst can be exploited to do this kind of tasks.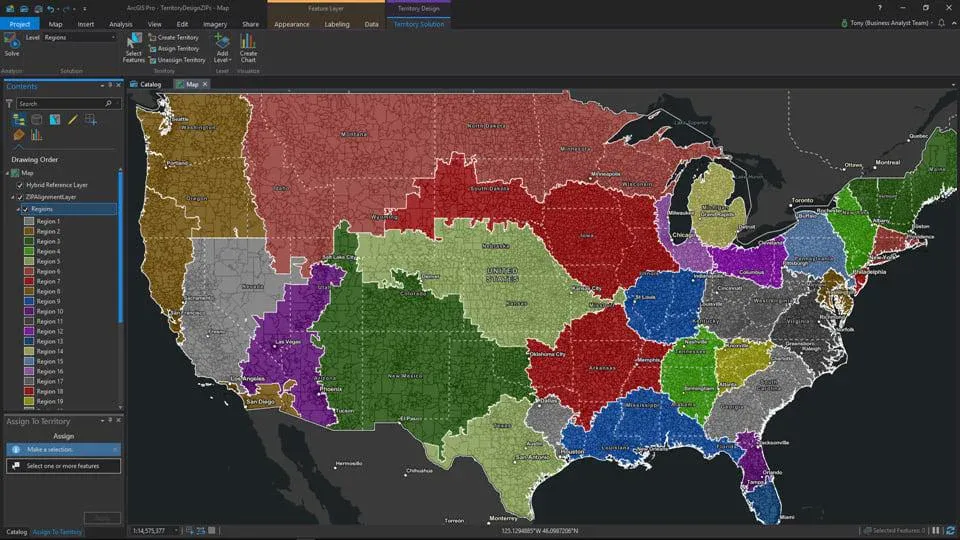
Figure 1. Main interface of ArcGIS Pro, the next-generation,64-bit and multithreaded desktop application from Esri is one of the most widely-used GIS programs for site selection.
On the other hand, QGIS, a free and open-source GIS software can also do site selection, using various libraries and plugins developed by its users, which can be downloaded and added to the main program.
Figure 2. Main user interface of QGIS, the leading free and open-source GIS software programs developed by OSGEO.
Since these software programs offer a ton of functionalities and capabilities aside from site selection, introducing them to beginners and non-technical people can be a little daunting. If you are an entrepreneur or a marketer who just wants to visualize and discover potential sites for your business or for your client’s business, you may need to hire additional technical people to leverage these applications.
Web-based Site Selection
In most desktop GIS programs, site selection analysis usually starts with determining the initial values of each factor and then proceeding with the spatial analysis. Any change in these values would mean running the spatial analysis again to visualize the results and iterate the process.
vMAP offers an intuitive and easy-to-use tool to quickly filter different variables in the data and then visualize them on the map. Using vMAP, you can use Color Filter, a dynamic filtering tool to simultaneously visualize the changes in the map as changes in the parameters are applied. This way, almost everyone, including entrepreneurs and marketers can do simple site selection and visualization on-the-fly through this web-based mapping tool.
Let’s say you are a business manager who is tasked to explore new sites for a male undergarments business in Vermont. You want to initially locate potential counties for your business depending on the population density, number of households, and male population. But due to uncertainty in the size of the budget coming from your parent company, the sales director wants to see different scenarios depending on the amount of budget that will be available for you to cover a certain market size.
To do this, you can use vMAP to import the spatial data of Vermont counties, together with the associated demographics data.
Figure 3. GIS data of Vermont counties imported in vMAP as shapefiles.
The Color Filter tool in vMAP allows you to set a Slider for the numeric variables that must be considered in your initial site selection. This allows you to explore what-if scenarios on the data and quickly communicate them in the form of a map.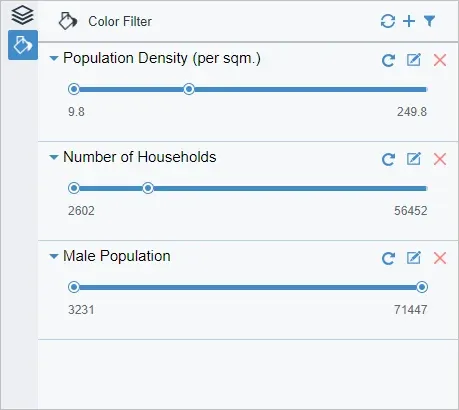
Figure 4. Slider Tool in Color Filter option in vMAP
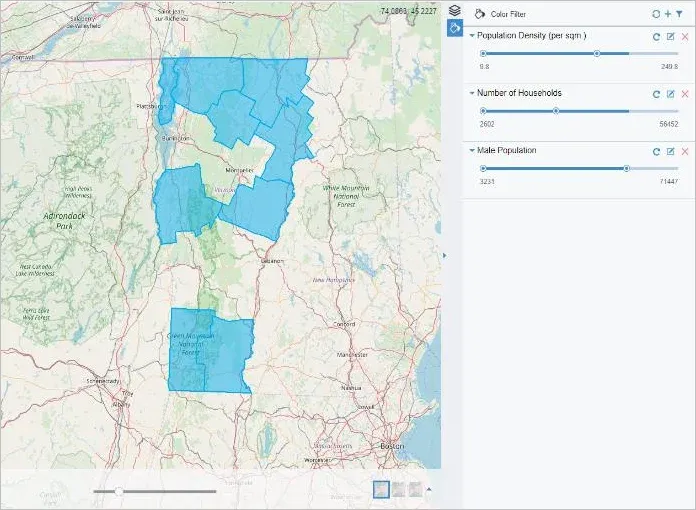
Figure 5. Scenario A
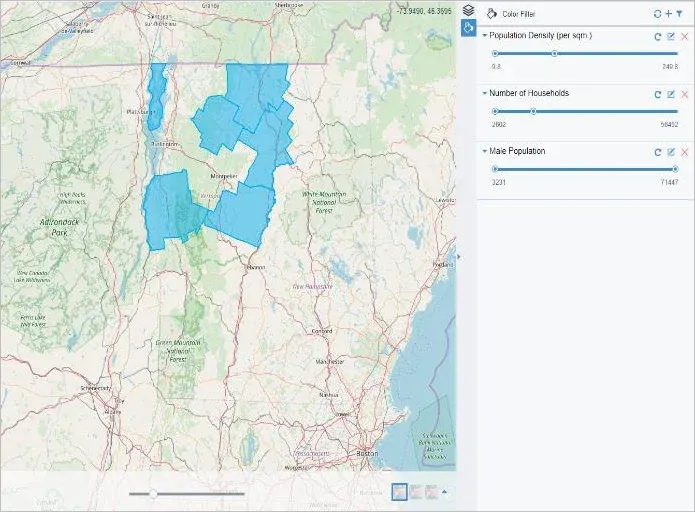
Figure 7. Scenario C
Depending on the variables being studied, additional Color Filter tools such as Histogram can also be used to filter the map.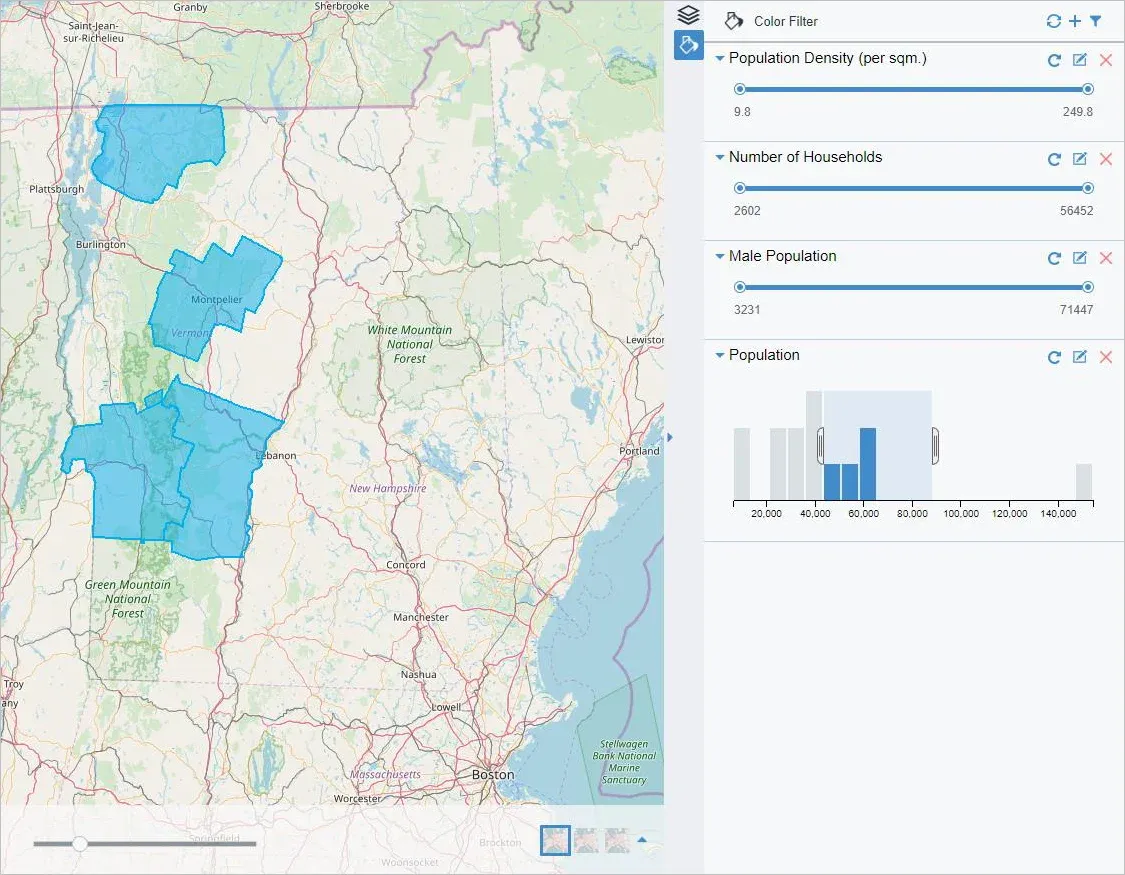
The simple but fast-rendering visualization for site selection in vMAP allows you to communicate the results as soon as changes are made in the variables’ values. The best thing is, since the user interface is user-friendly, you do not need to hire additional technical people to do the job.